Borda Sensei
A mobile app for Borda’s temperature, humidity and particle sensors
- Year
- 2022
- Track
- design
- Category
- case-study
When a vaccine fridge drifts above 8 °C, someone has to find out within minutes. If nobody notices until the end of a shift, the stock gets thrown away. Sensei is the app pharmacy and lab managers use to keep an eye on the Borda tags in their fridges, freezers and cold rooms, across every site they run. I designed it end to end, from scanning a new tag to the alarm that reaches the on-call pharmacist.
Where it started
As the Borda product team we were working on expanding the capabilities of our IoT devices, and this was our first entry into the cold-chain tracking market. We kept getting feedback from our customers and kept honing the product. Initially we had two customers.
What I set out to do
I kept three rules in front of me the whole way through:
- Show what needs attention first. Most of the time everything is fine. The app should make that obvious at a glance, and make the exception impossible to miss.
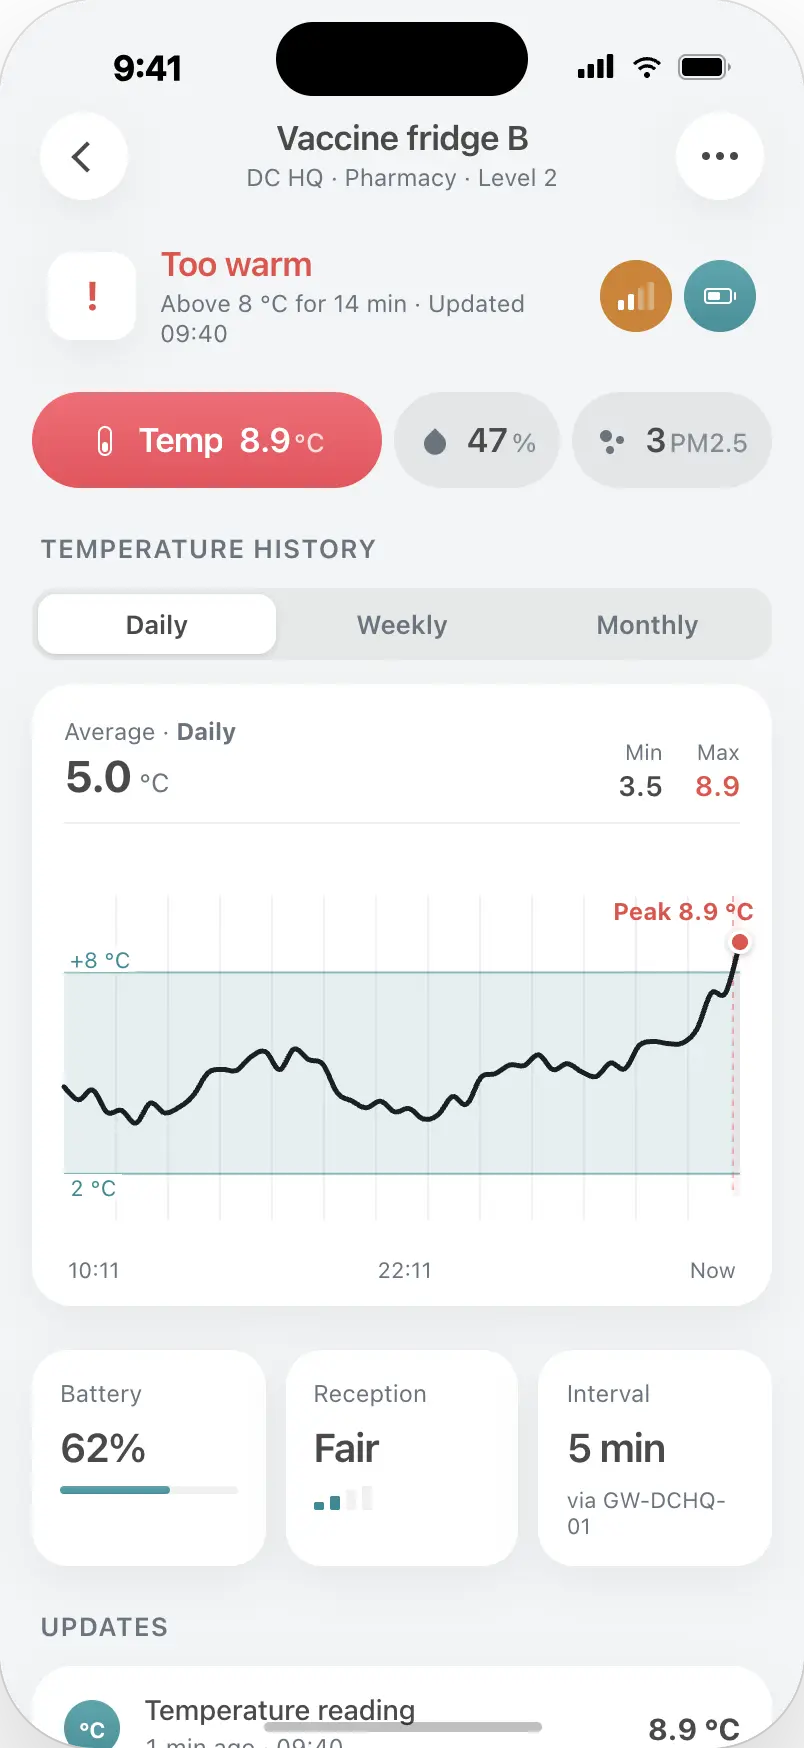
- Read every number against its safe range. 8.9 °C only means something when you can see it next to 2–8 °C.
- Write rules in plain language. The person setting an alarm should be able to read it back like a sentence.
Walking through it
Signing in
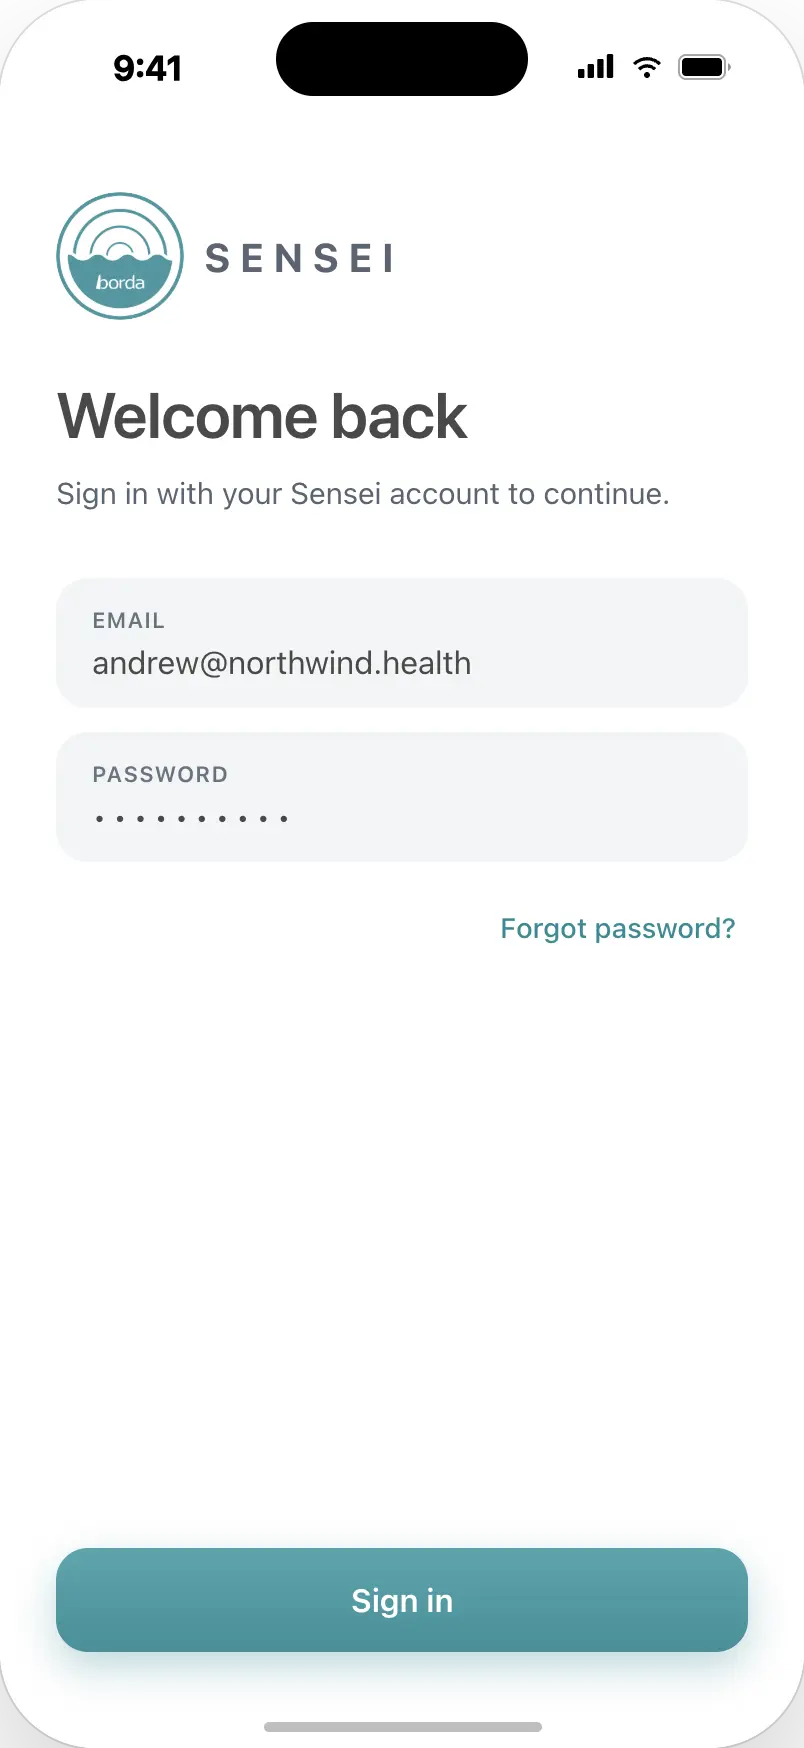
I kept the splash and sign-in screens quiet: the logo, the name and one field per line. The teal from the Borda mark is the only accent colour in the app. That leaves red free to mean one thing everywhere: something is out of range.
Dashboard
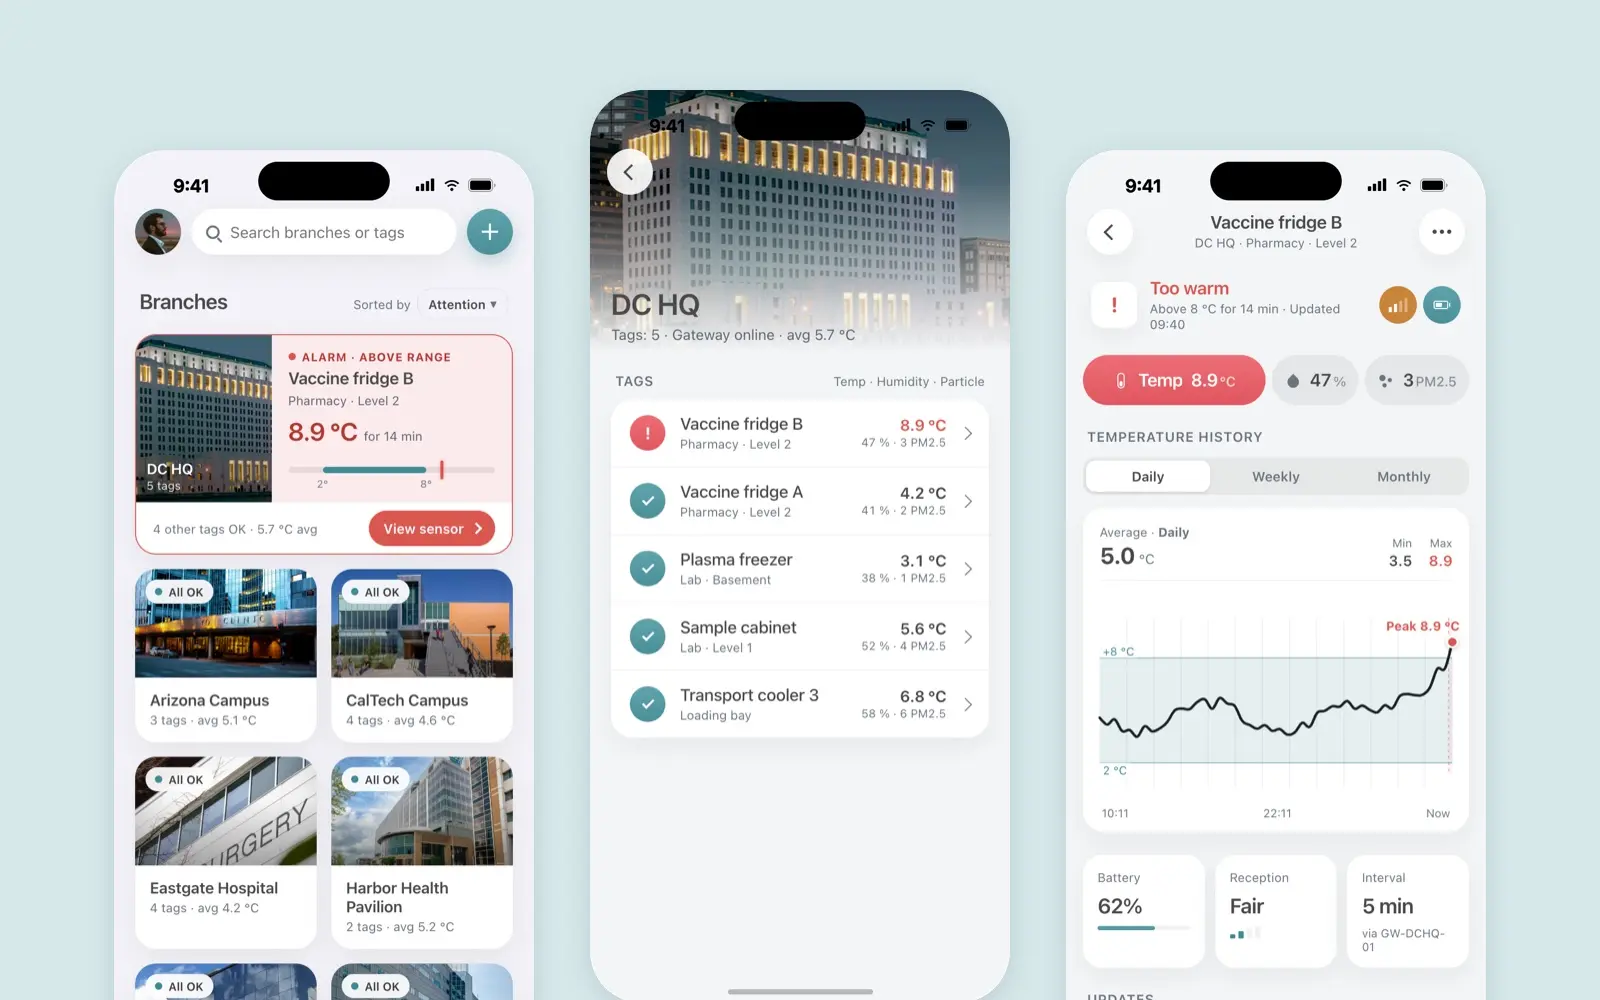
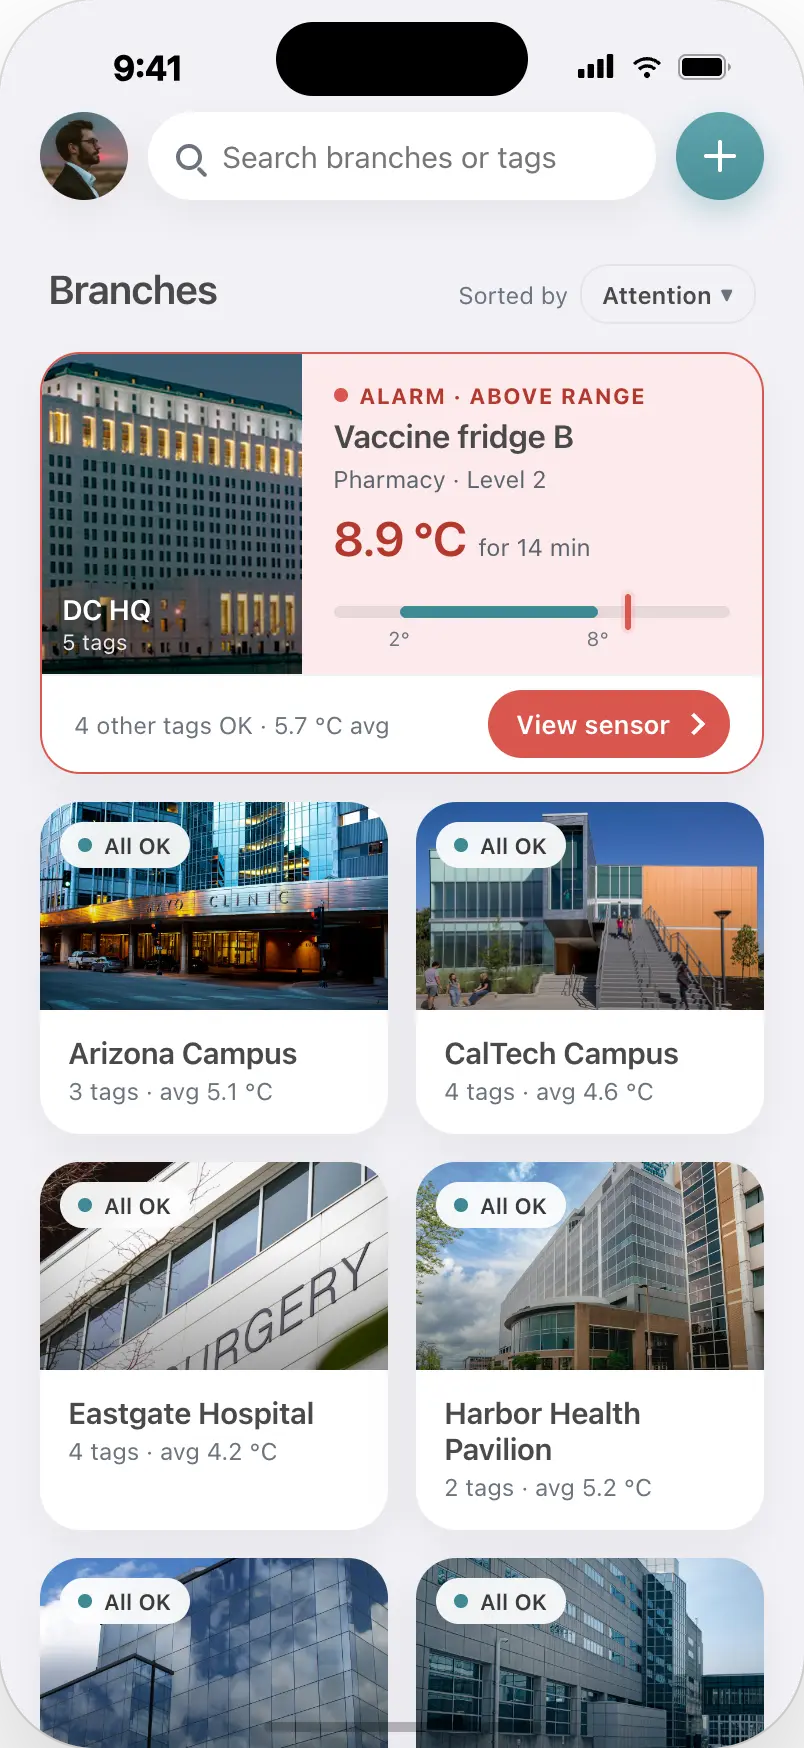
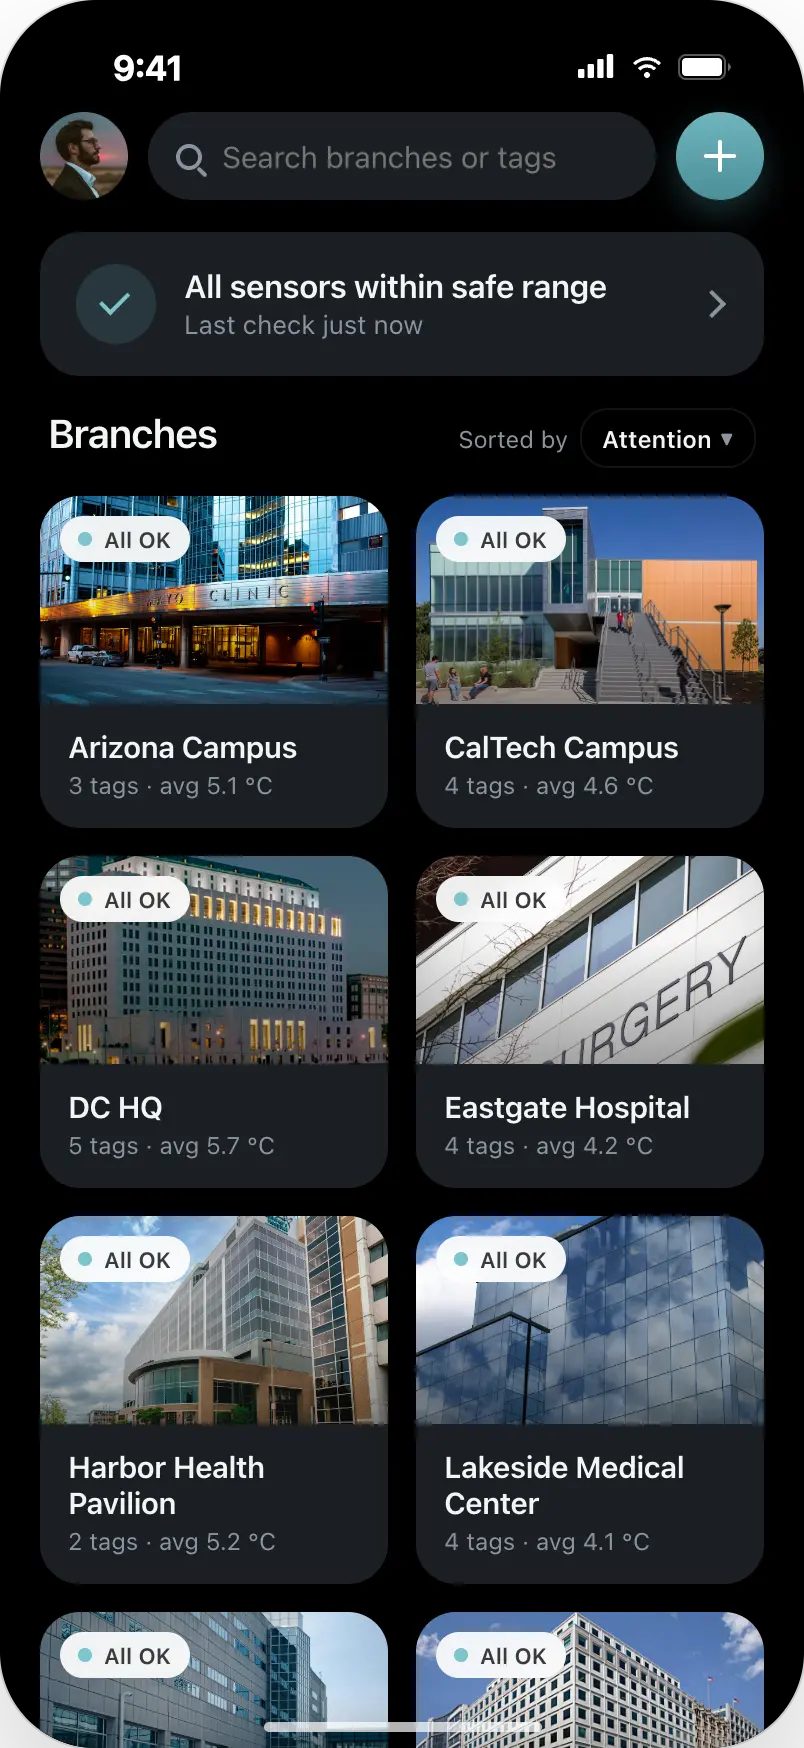
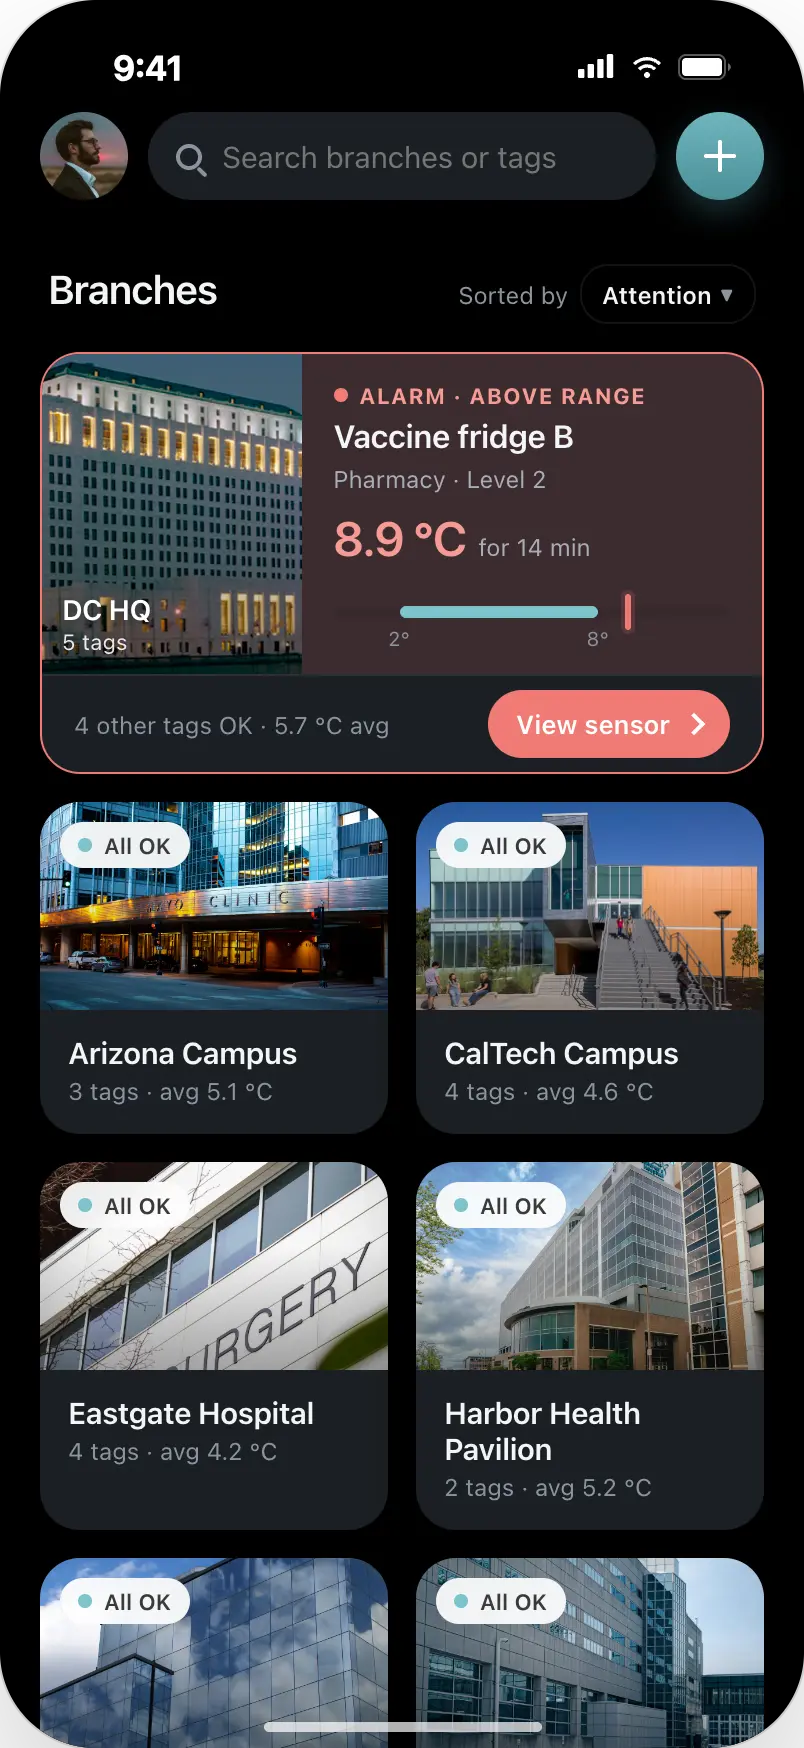
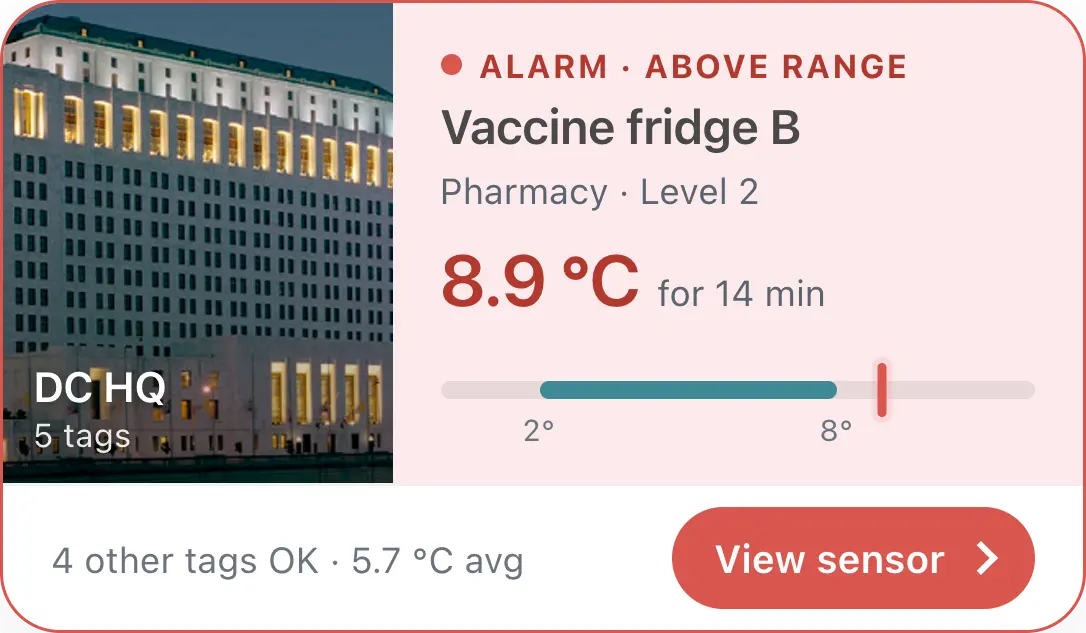
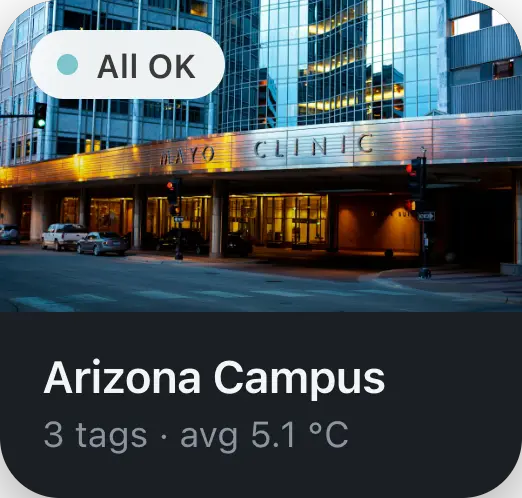
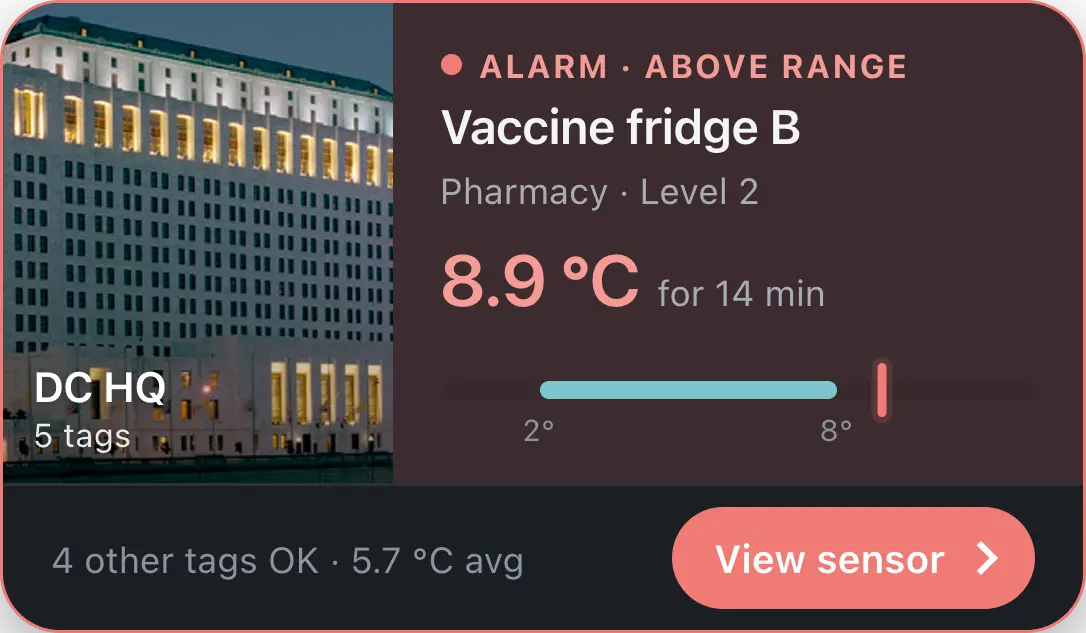
Branches are sorted by attention by default, so a site with a problem rises to the top on its own. Its card grows to full width and shows what matters: which fridge, where it is, the reading, how long it has been out of range, and a small bar placing 8.9 °C against the 2–8 °C band. Every other site stays a compact photo card with an “All OK” badge. Search and the add-tag button stay at the top where your thumb expects them.
Branch
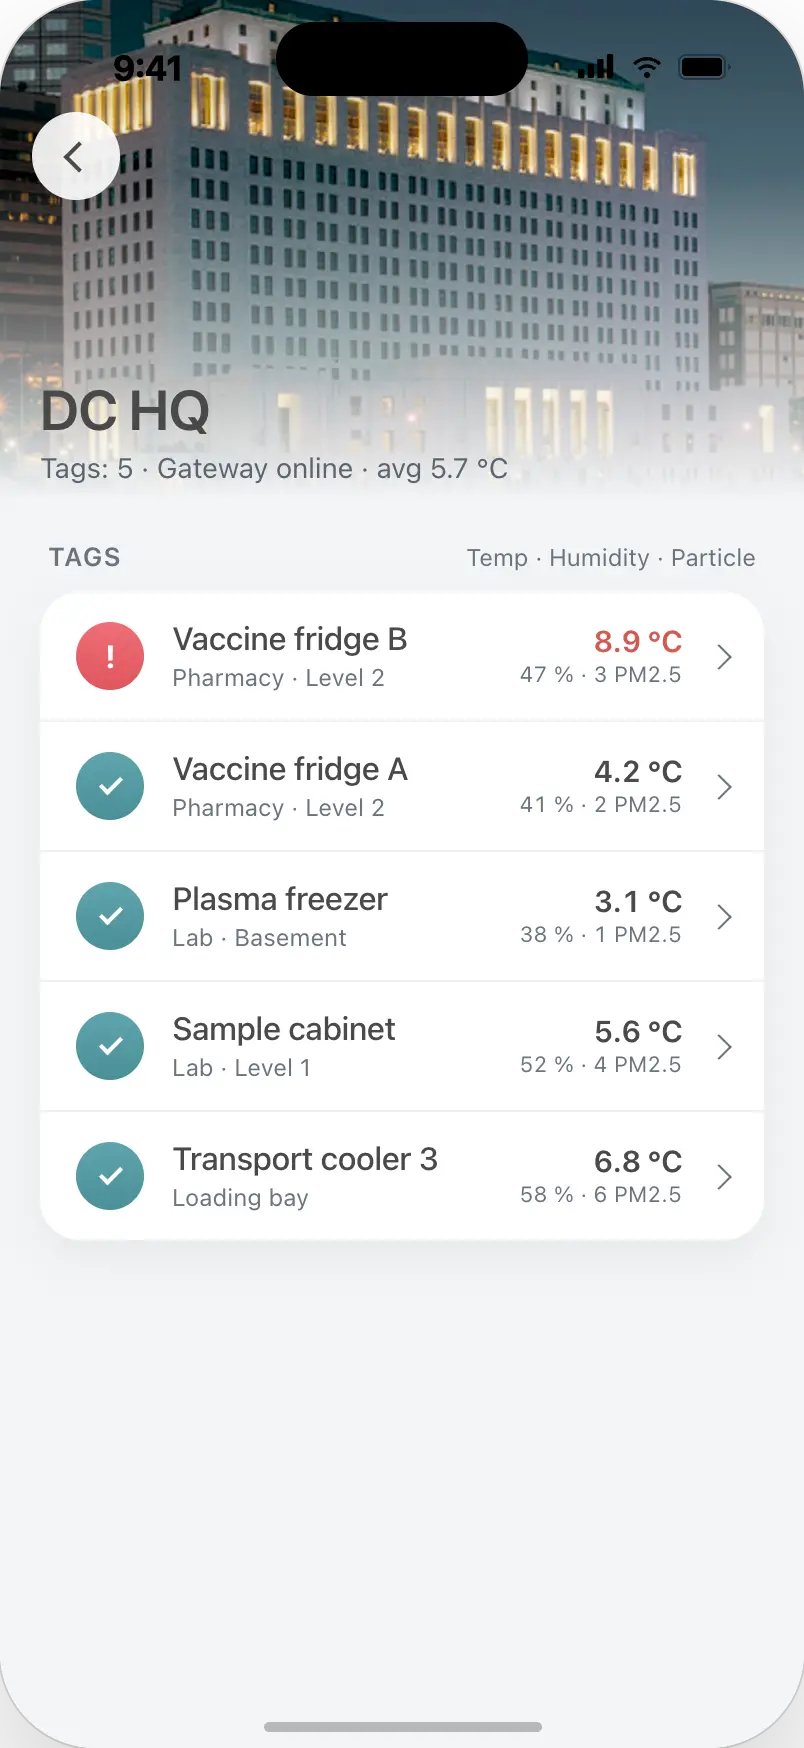
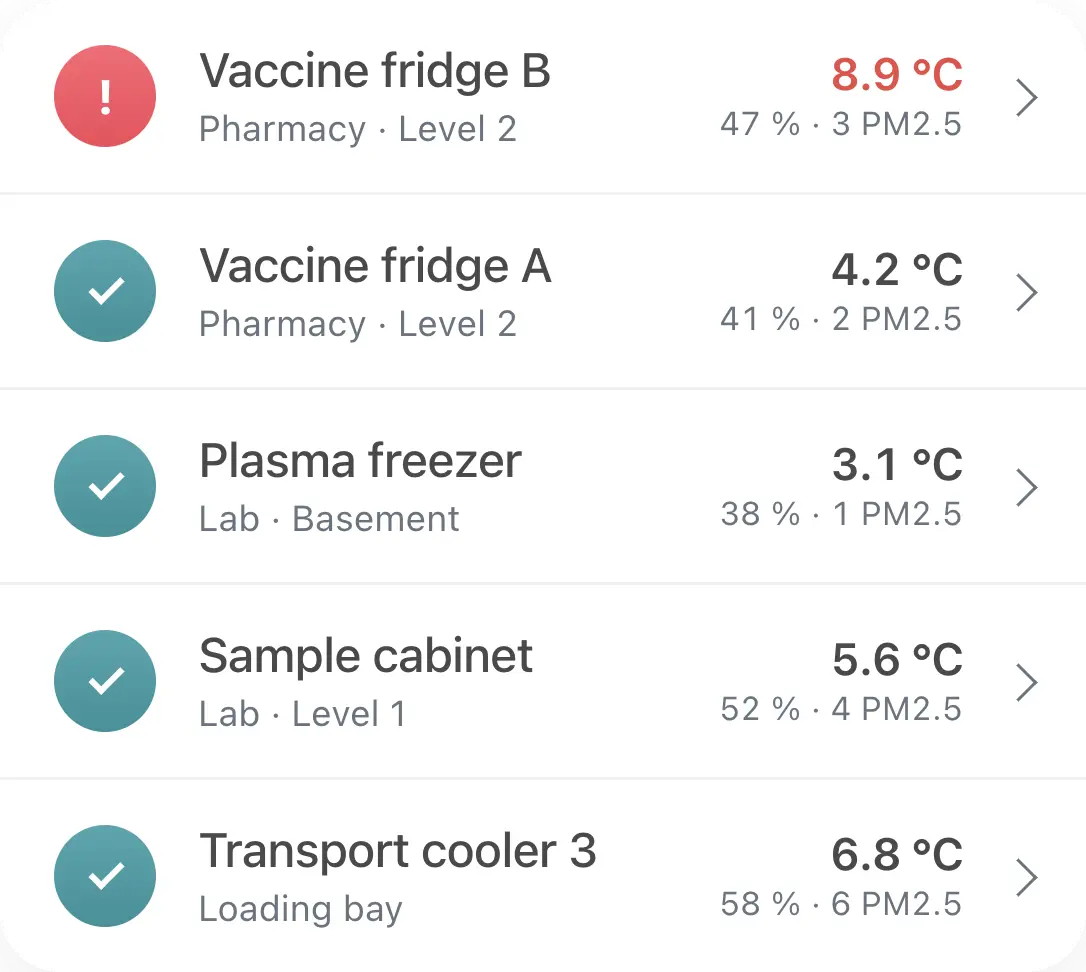
Opening a branch carries its photo up into the header, so you keep your sense of place. Each tag shows its temperature with humidity and particles underneath, and the tag in alarm is the only red row.
Tag detail
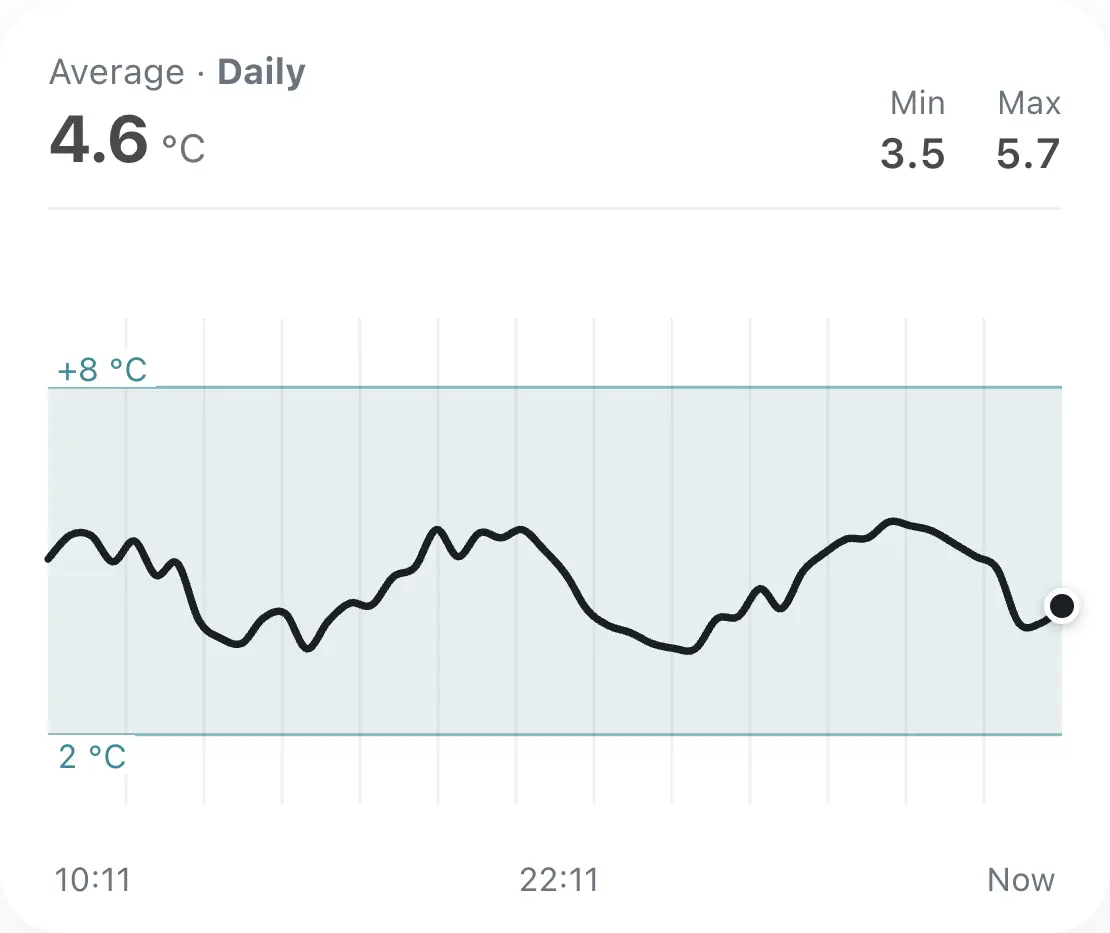
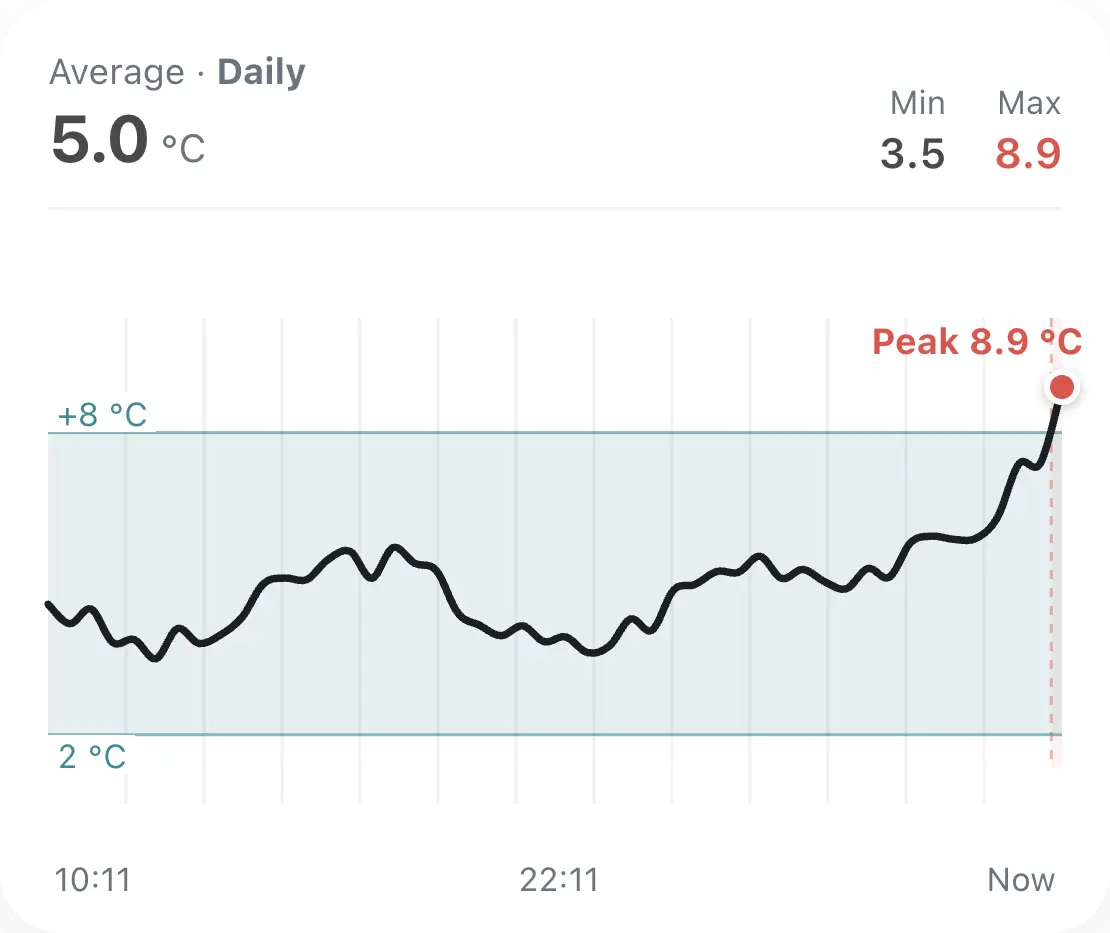
Here the questions are “how bad?” and “since when?”. The status line answers in words first: too warm, above 8 °C for 14 minutes. Pills switch between the three sensors. The history chart shades the safe band, labels the peak and marks where the alarm started, and you can drag across it for exact values. Battery, reception and reporting interval sit below, followed by a timeline of recent readings.
Adding a tag
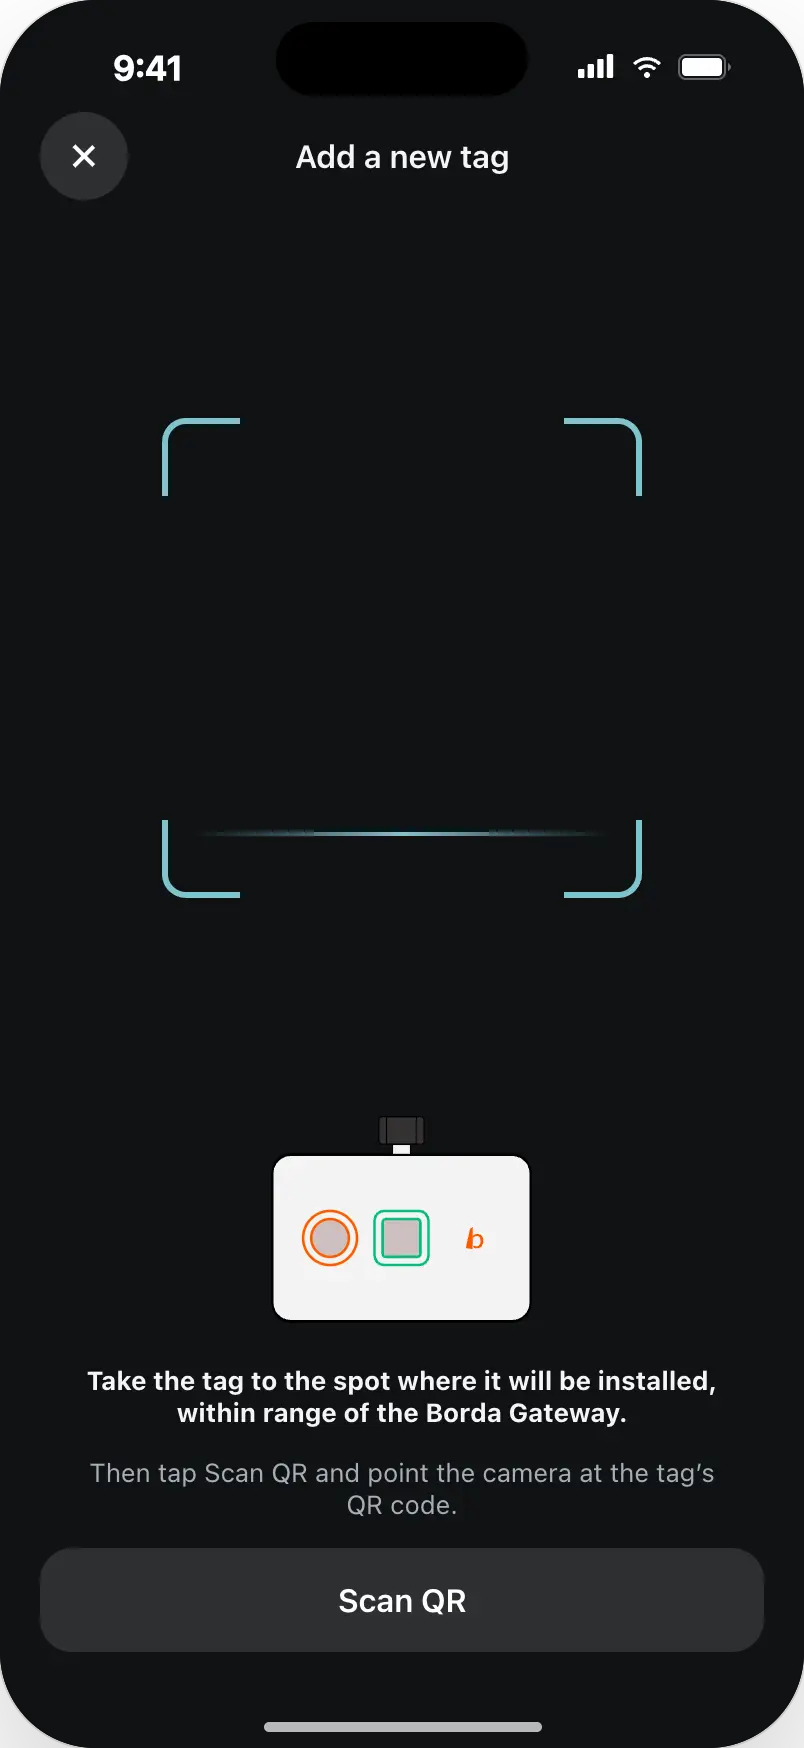
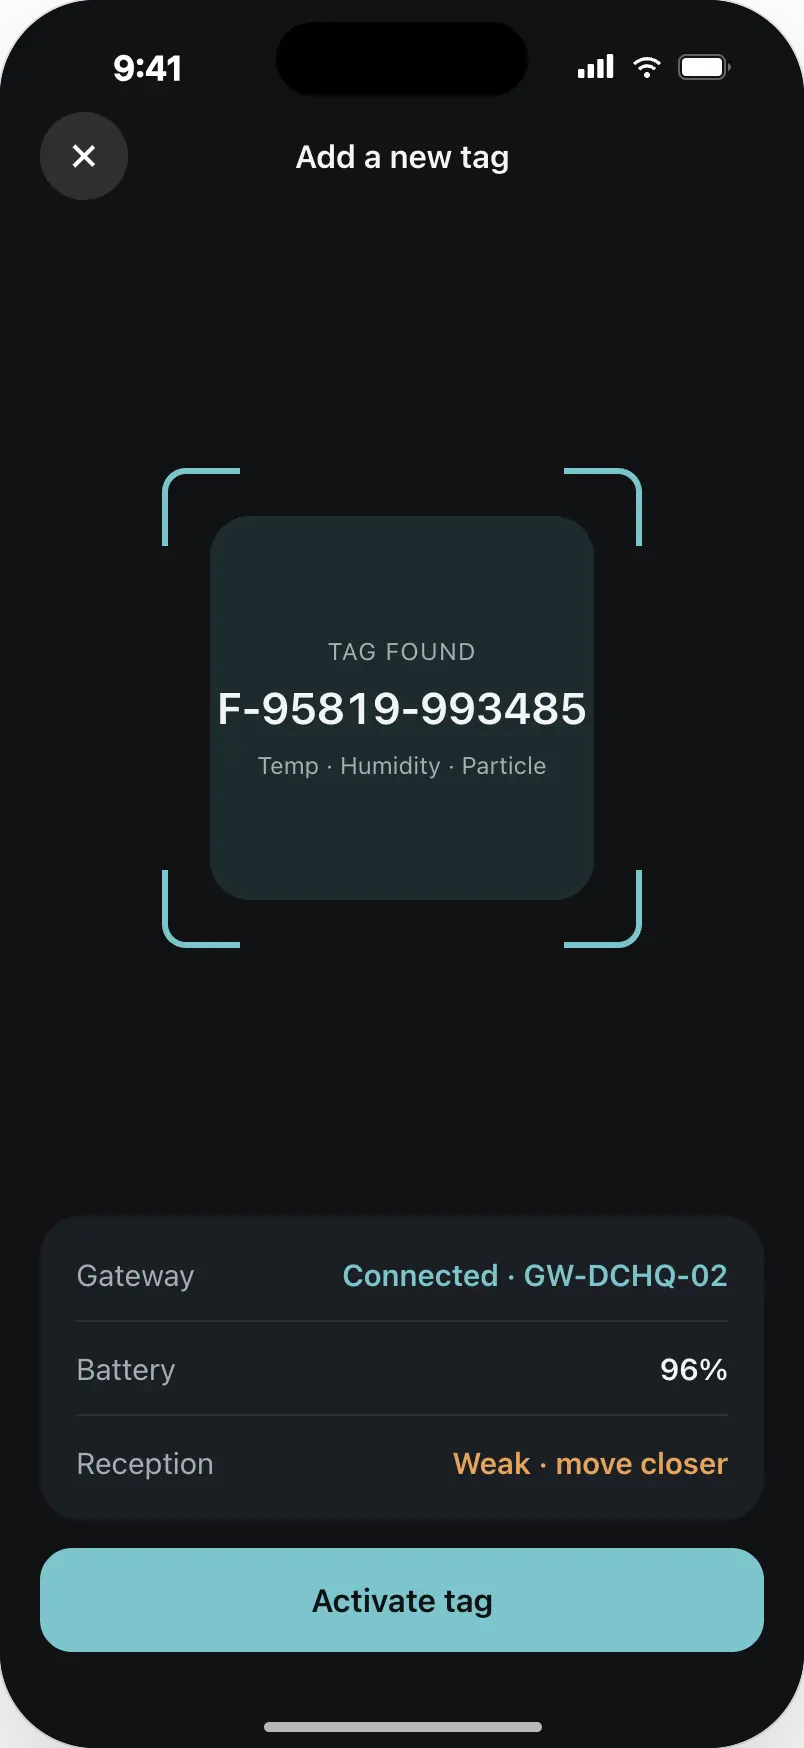
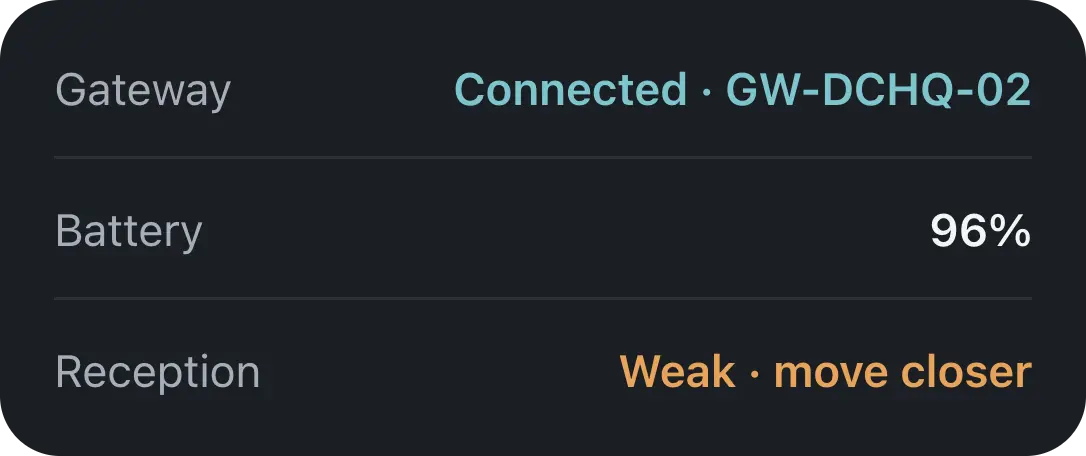
Tags are installed on site, often by the same people who read the data later. The flow asks them to stand where the tag will live, within range of the gateway, and scan its QR code. Before activation it checks the gateway connection, battery and reception, and flags a weak signal while they are still standing there and can move closer.
Alarm rules
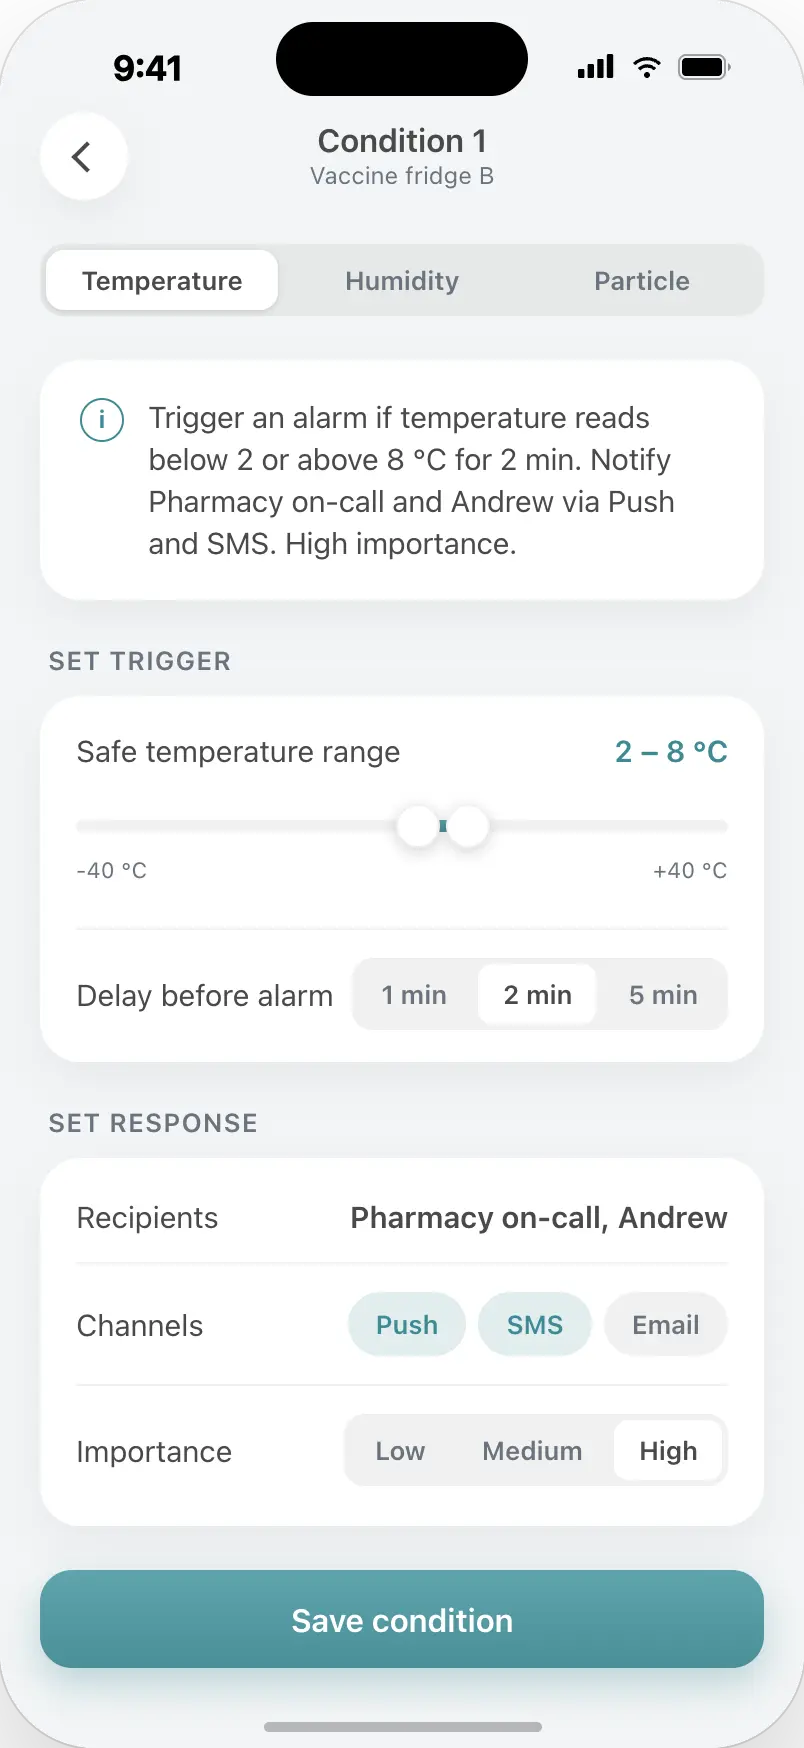
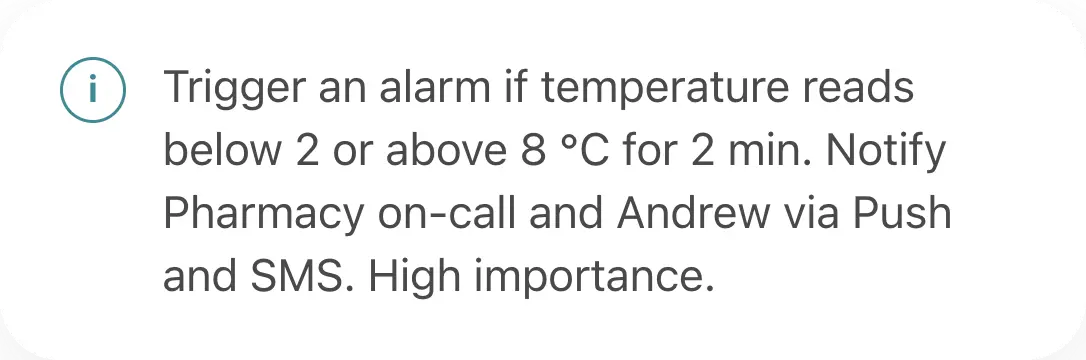
Setting a rule used to mean filling in thresholds. I added a summary at the top that reads the rule back as a sentence and rewrites itself as you change the range, delay, channels or importance: “Trigger an alarm if temperature reads below 2 or above 8 °C for 2 min. Notify Pharmacy on-call and Andrew via Push and SMS.” If the sentence sounds wrong, the rule is wrong.
Dark mode
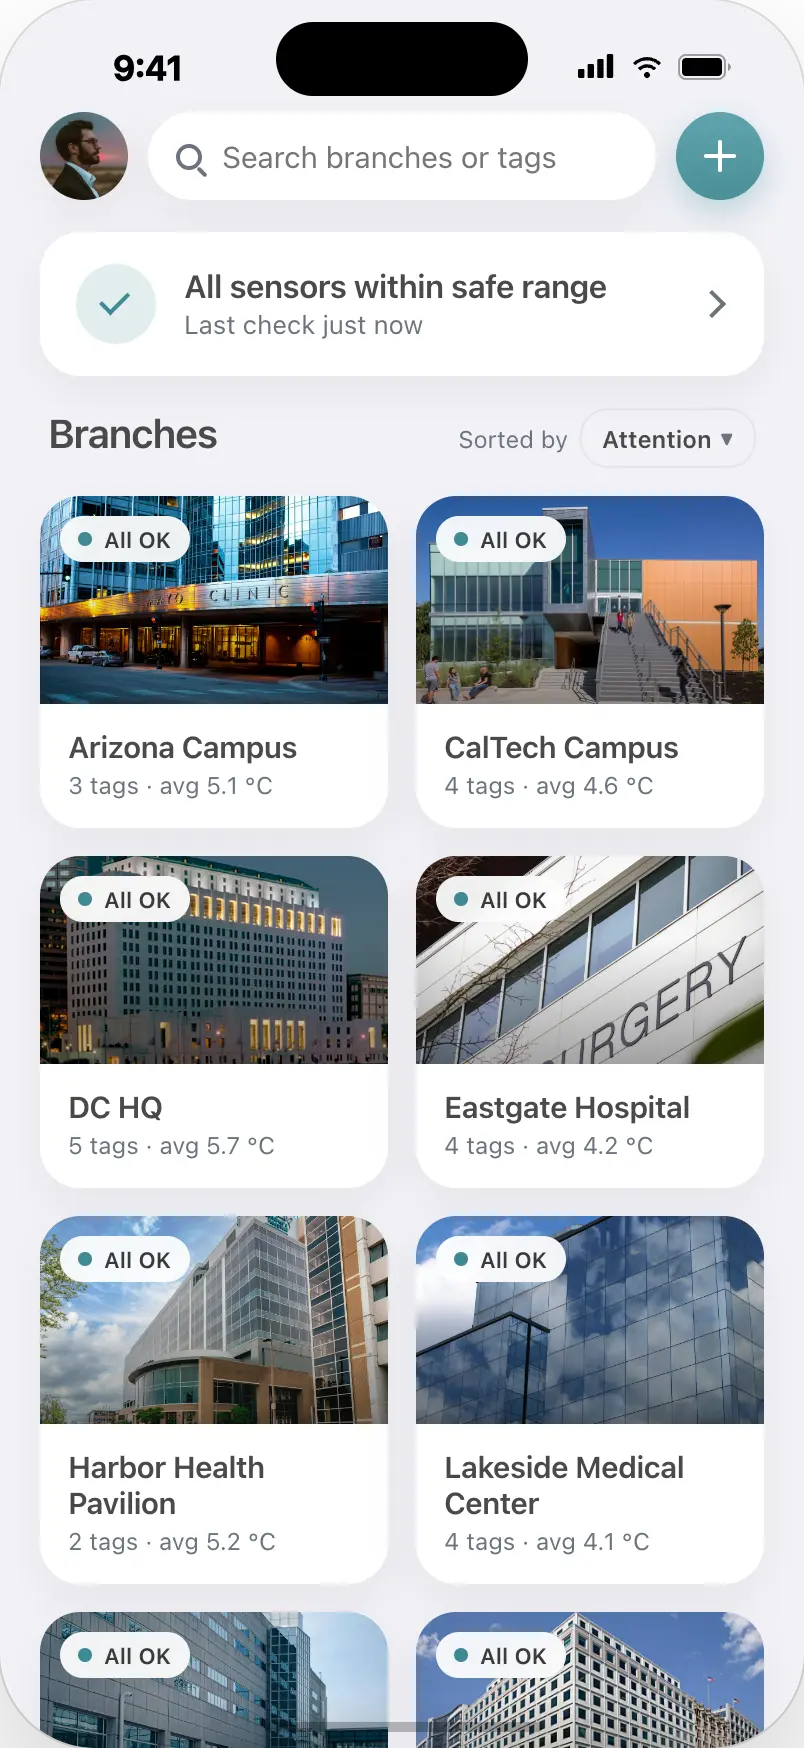
Fridges get checked on night shifts too. The dark theme keeps the same layout and lifts the teal and red so alarms stay easy to read without glare. The scanner is always dark, which keeps the focus on the camera view.
One alarm, two states
Most of the time nothing is wrong, so I designed the key components in pairs: how each one looks when everything is fine, and how it changes when a reading goes out of range. The alarm version always adds information instead of only turning red.
Dashboard
When every site is fine, one calm banner says so, with the time of the last check. When a fridge goes out of range, the banner steps aside and that branch's card takes its place at the top.
Branch cards
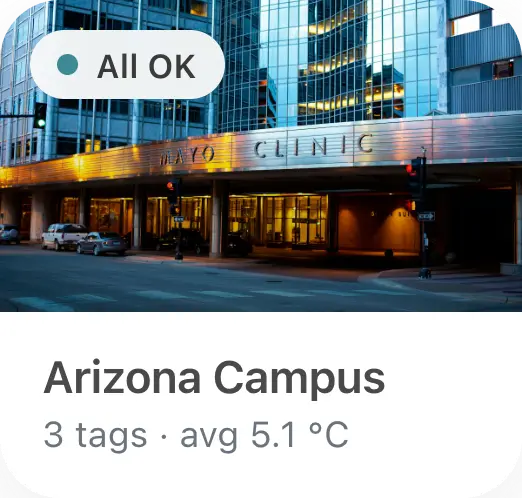
An OK branch is a photo, a name and an average. The alarm card keeps the photo but gives most of its space to the problem: the fridge, the reading, the time out of range and where it sits against the safe band.
Status lines and charts
On a tag, the status line leads with one word: “Normal” in teal or “Too warm” in red. The chart shades the same safe band in both states. In alarm it adds a peak label and a marker where the alarm started.


Tag list
Inside a branch, the tag in alarm is the only row with a red icon and a red reading, so it stands out in a list of five.
Smaller pieces


In dark mode

More case studies
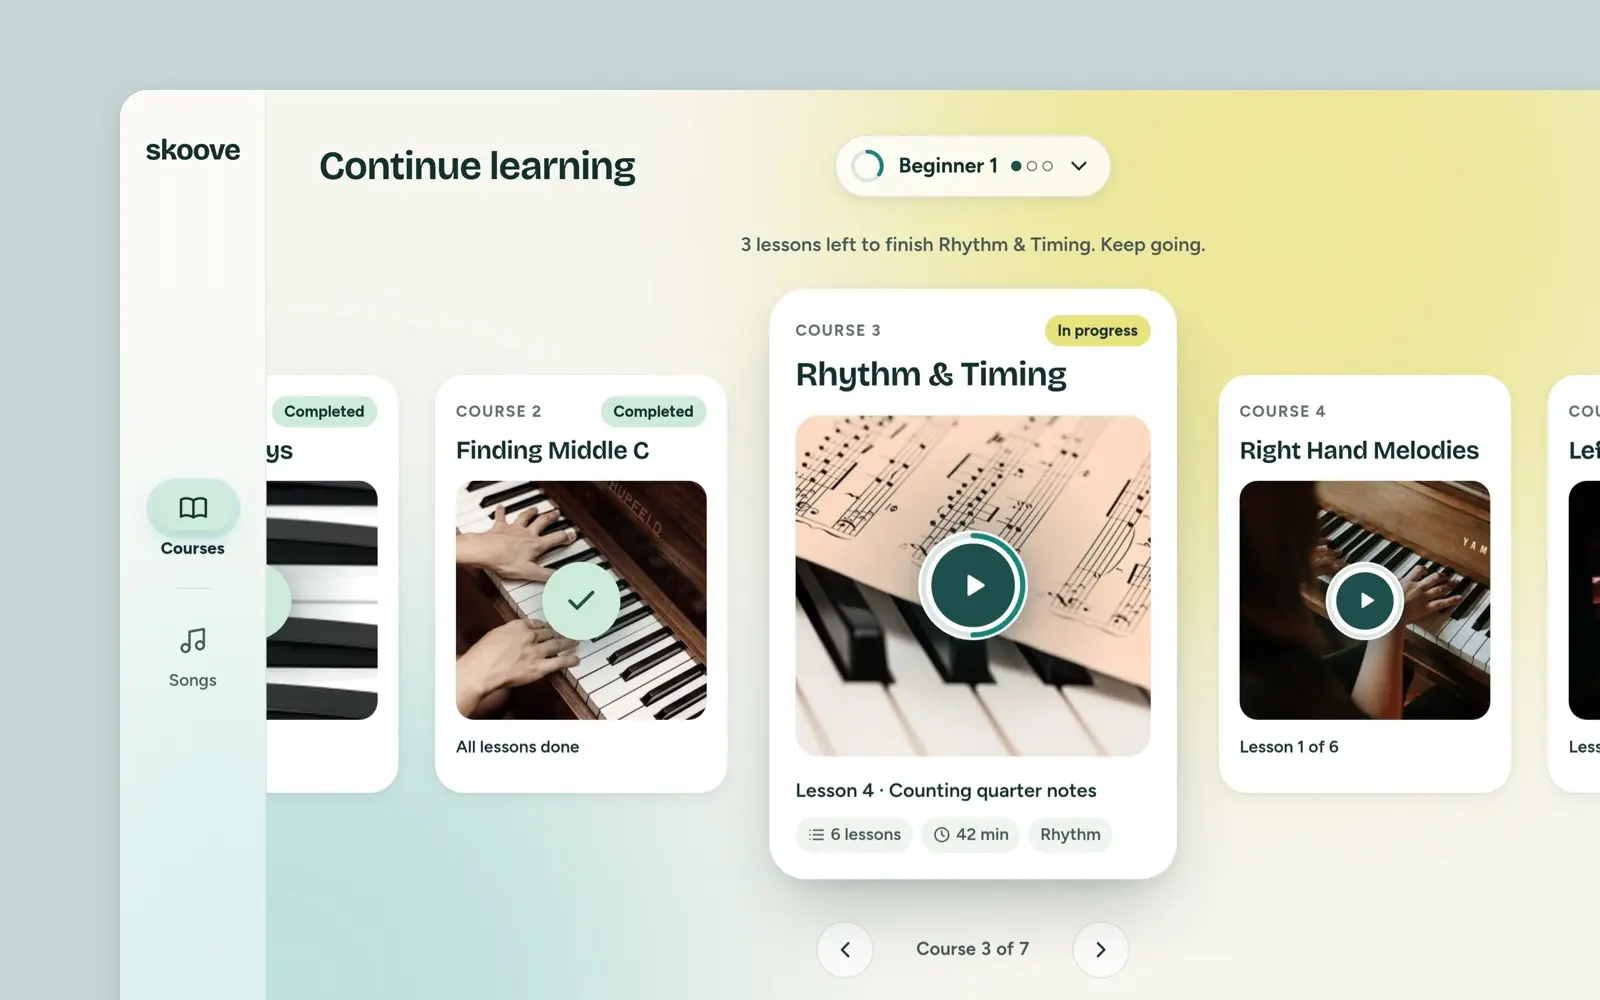
Skoove
Skoove said its iPad dashboard looked scattered. My answer, from a March 2022 task: a first page that opens on your course, Courses and Songs in a room each.
case study · 2022 · read it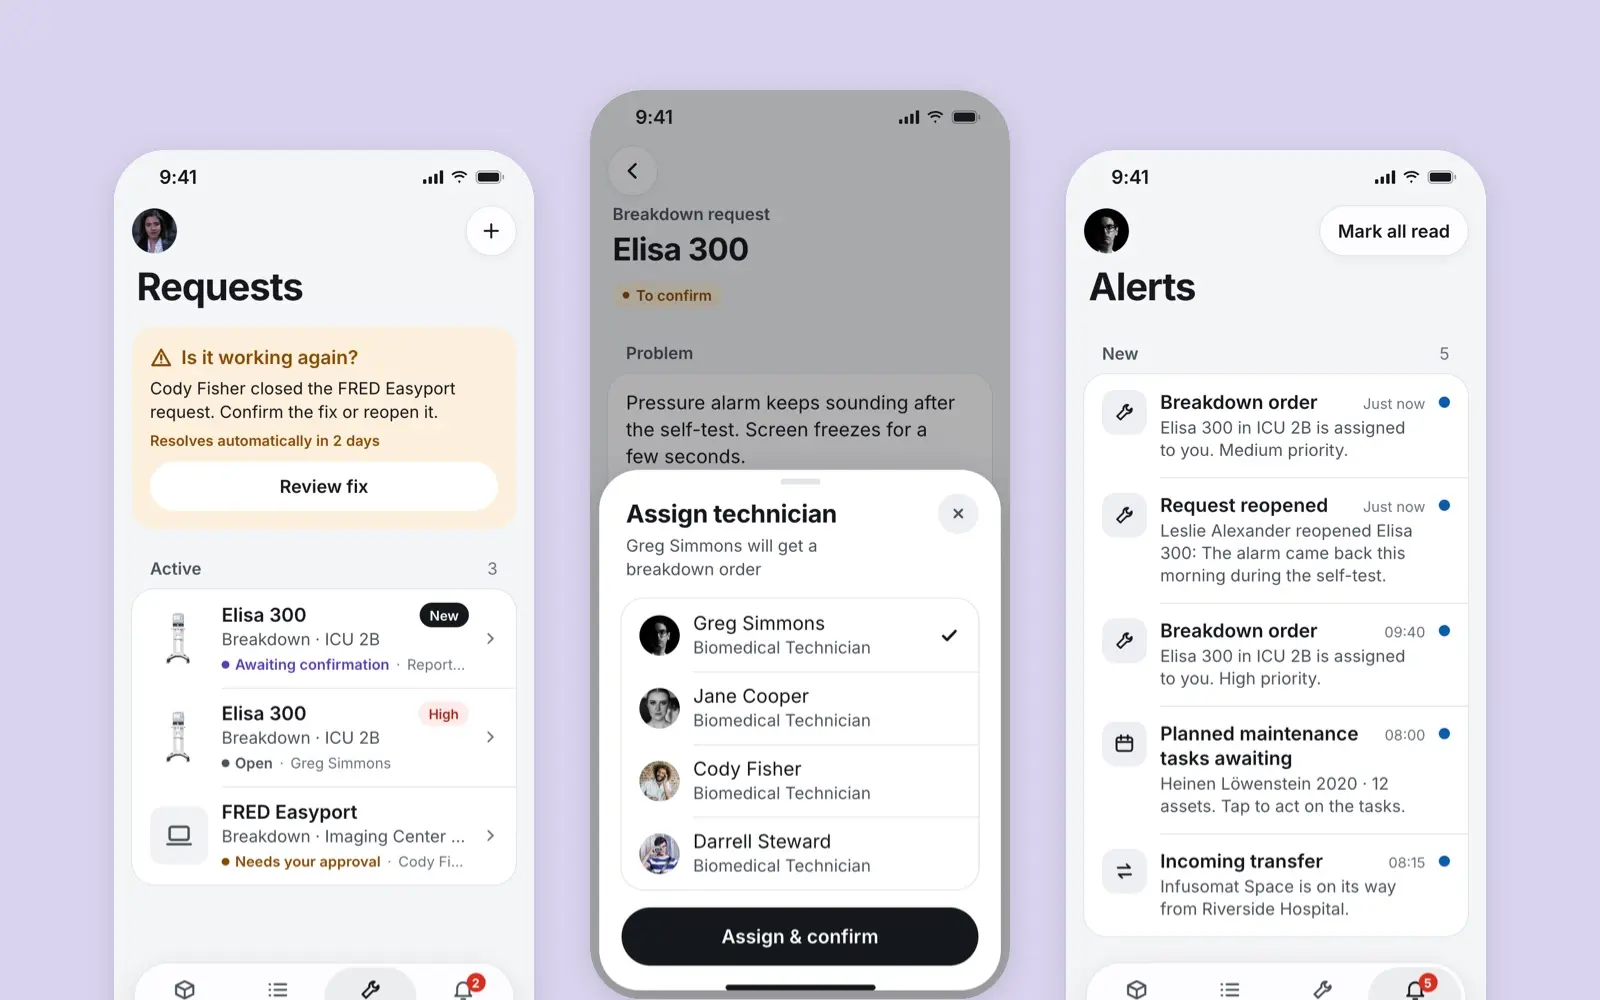
Lighthouse
A mobile app for the nurses, technicians and managers who keep a hospital's medical devices working, designed for Borda
case study · 2021 · read it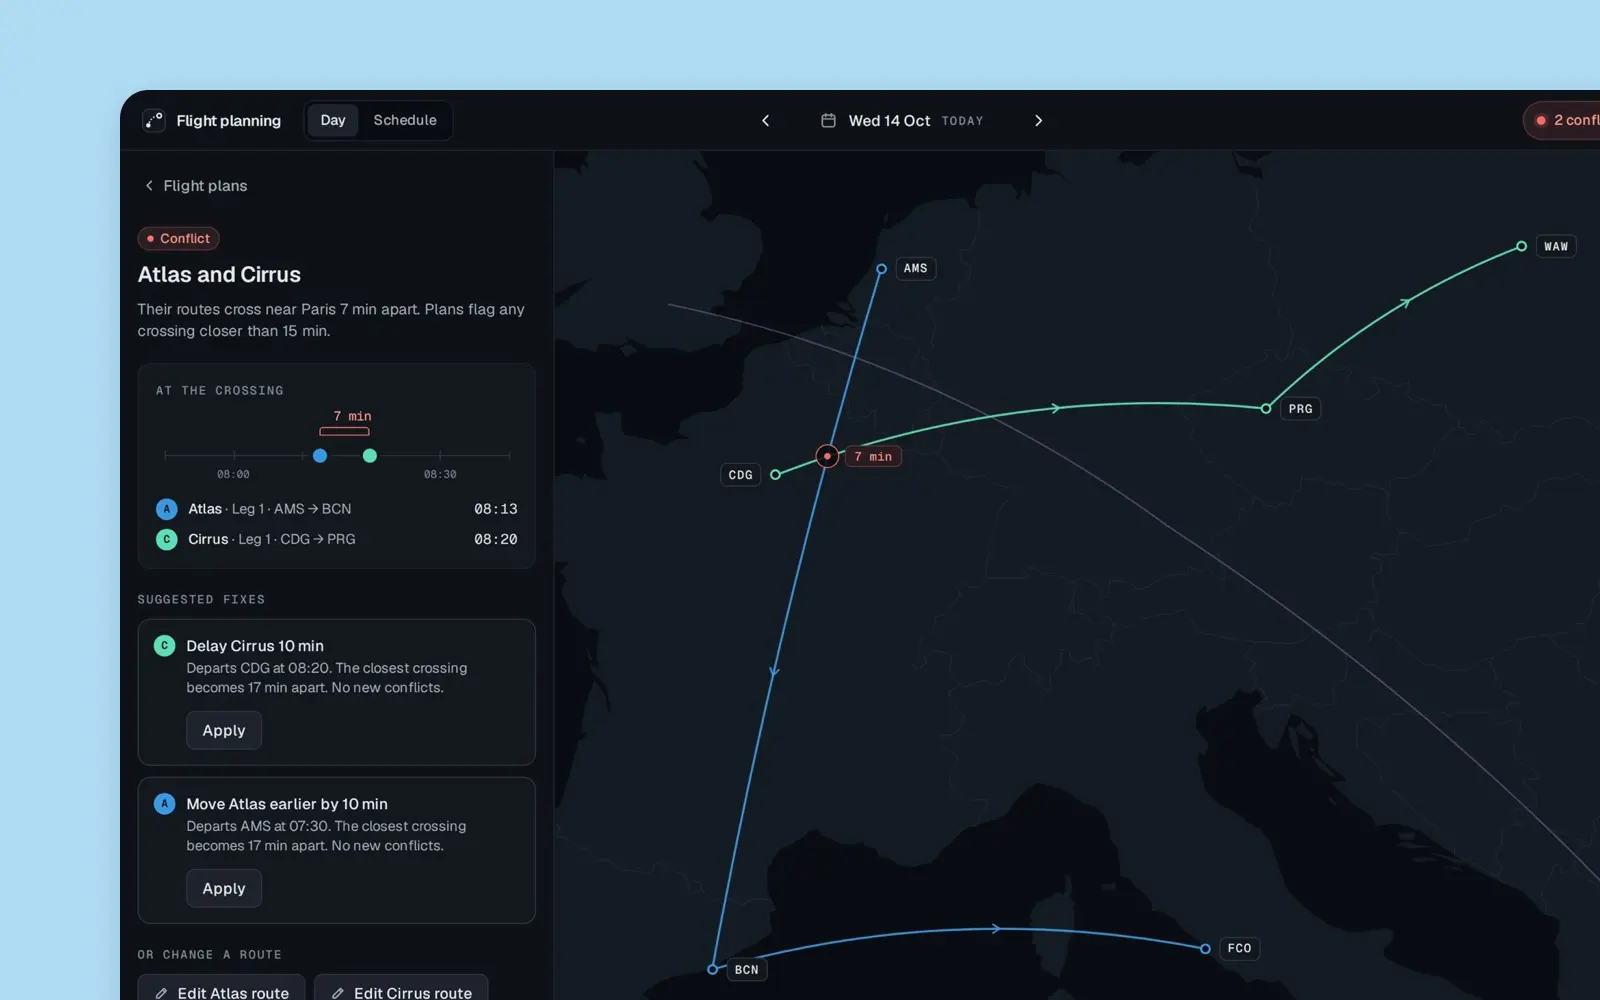
Flight Planning
A planner for three aircraft, from a December 2019 take-home task: today's plans beside one map, every crossing shown, only the close ones in time a conflict.
case study · 2019 · read it